Article-At-A-Glance: Your State-Specific Pollen Forecast Guide
- Pollen seasons are hyper-local — what’s blooming in Florida in February may not hit Oregon until May, and your allergy plan should reflect that difference.
- Three pollen types drive most seasonal allergies: tree, grass, and weed pollen, each peaking at different times of year depending on your state’s climate and vegetation.
- Reading a pollen count correctly can change how and when you take medication — most people are reacting to yesterday’s pollen, not today’s.
- Allergy Ava provides state-by-state and city-level pollen forecasts to help you track allergens specific to your region, not just a national average.
- One overlooked strategy for travelers and relocators is using state pollen forecasts before arriving — the section on travel planning covers exactly how to do this.
Not all pollen seasons are created equal, and where you live makes all the difference in how bad your allergies actually get.
Most allergy sufferers check a generic forecast and wonder why their symptoms don’t match what the app says. The answer almost always comes down to geography. A blanket national pollen forecast misses the fact that live oak trees in Texas release pollen in late January, while birch trees in Minnesota don’t start until April. The difference of just a few hundred miles can mean the difference between clear sinuses and a week of misery.
Your State’s Pollen Season Is Not the Same as Your Neighbor’s
Pollen exposure is shaped by local plant species, regional climate patterns, elevation, humidity, and wind behavior. Two states sharing a border can have wildly different allergy seasons depending on what grows there and when temperatures warm up enough to trigger blooming.
States in the Southeast like Florida, Georgia, and Alabama deal with some of the earliest and longest pollen seasons in the country. Meanwhile, northern states like Minnesota, Wisconsin, and Maine often don’t see significant pollen activity until late spring. Western states add another layer of complexity because elevation dramatically shifts bloom timing — Denver residents may experience mountain cedar pollen weeks after lowland areas have already peaked.
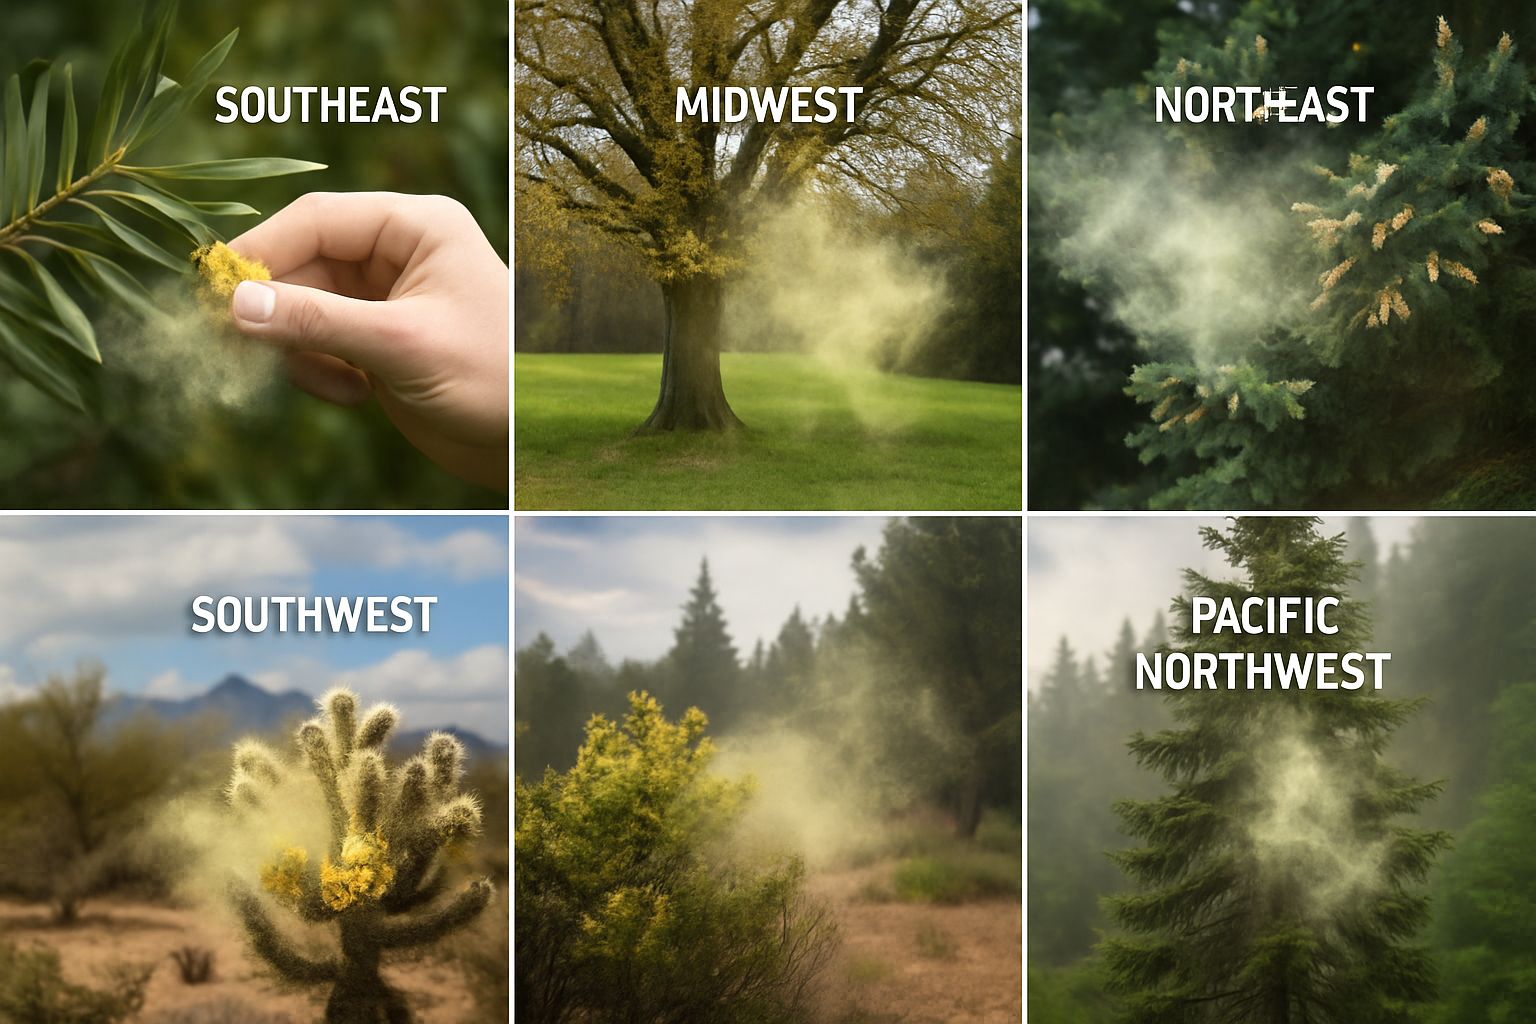
- The Southeast has some of the earliest pollen seasons, often starting in January or February with tree pollen from oak, pine, and cedar species.
- The Midwest sees a compressed but intense allergy season, with tree, grass, and weed pollen often overlapping in spring and early summer.
- The Northeast experiences a delayed but significant birch and maple pollen season, typically ramping up in April and May.
- The Southwest struggles with juniper and olive tree pollen, along with desert weeds like tumbleweeds and sagebrush that peak in late summer and fall.
- The Pacific Northwest has a longer grass pollen season than most of the country, with cool and wet conditions extending allergenic exposure well into summer.
Understanding which region you’re in — and what plants dominate that region — is the first step to actually managing your symptoms rather than just reacting to them.
Tree, Grass, and Weed Pollen Each Have Their Own Season
- Tree pollen is typically the first to appear, beginning as early as January in warm states and lasting through early summer in cooler ones. Common culprits include oak, birch, cedar, maple, and elm.
- Grass pollen follows trees, usually peaking from late spring into midsummer. Timothy grass, Bermuda grass, and Kentucky bluegrass are among the most allergenic species depending on your region.
- Weed pollen dominates late summer and fall. Ragweed is the most well-known offender, but sagebrush, mugwort, and pigweed are heavy hitters in western and central states.
These three seasons don’t always follow a clean sequence. In many states — especially those with mild winters — tree and grass pollen seasons overlap, which can make it almost impossible to identify which allergen is hitting you hardest without a state or city-specific breakdown.
This is exactly why state-specific forecasts matter so much. A forecast that tells you pollen is “high” without specifying whether it’s tree, grass, or weed pollen isn’t giving you enough information to act on. Knowing that cedar elm is at peak release in your Texas city lets you pre-medicate or wear a mask before outdoor activities. A general “high pollen day” warning doesn’t.
Why Regional Climate and Vegetation Change Everything
Rainfall, temperature, wind speed, and humidity all directly influence how much pollen is released and how far it travels. A rainy spring can suppress pollen counts temporarily by washing particles out of the air, but it also promotes plant growth, leading to larger and more intense pollen releases once conditions dry out. This pattern is one reason allergy seasons after wet winters tend to be particularly brutal.
Vegetation type is just as important as climate. Coastal California’s landscape is dominated by grasses and introduced Mediterranean species, creating a grass pollen season that stretches from February through October in some areas. Compare that to the arid Southwest, where wind-pollinated desert shrubs like Russian thistle and saltbush drive most of the weed pollen burden in summer and fall. The local plant profile of your state is essentially the blueprint for your personal allergy calendar.
How Checking Your State Forecast Changes How You Manage Allergies
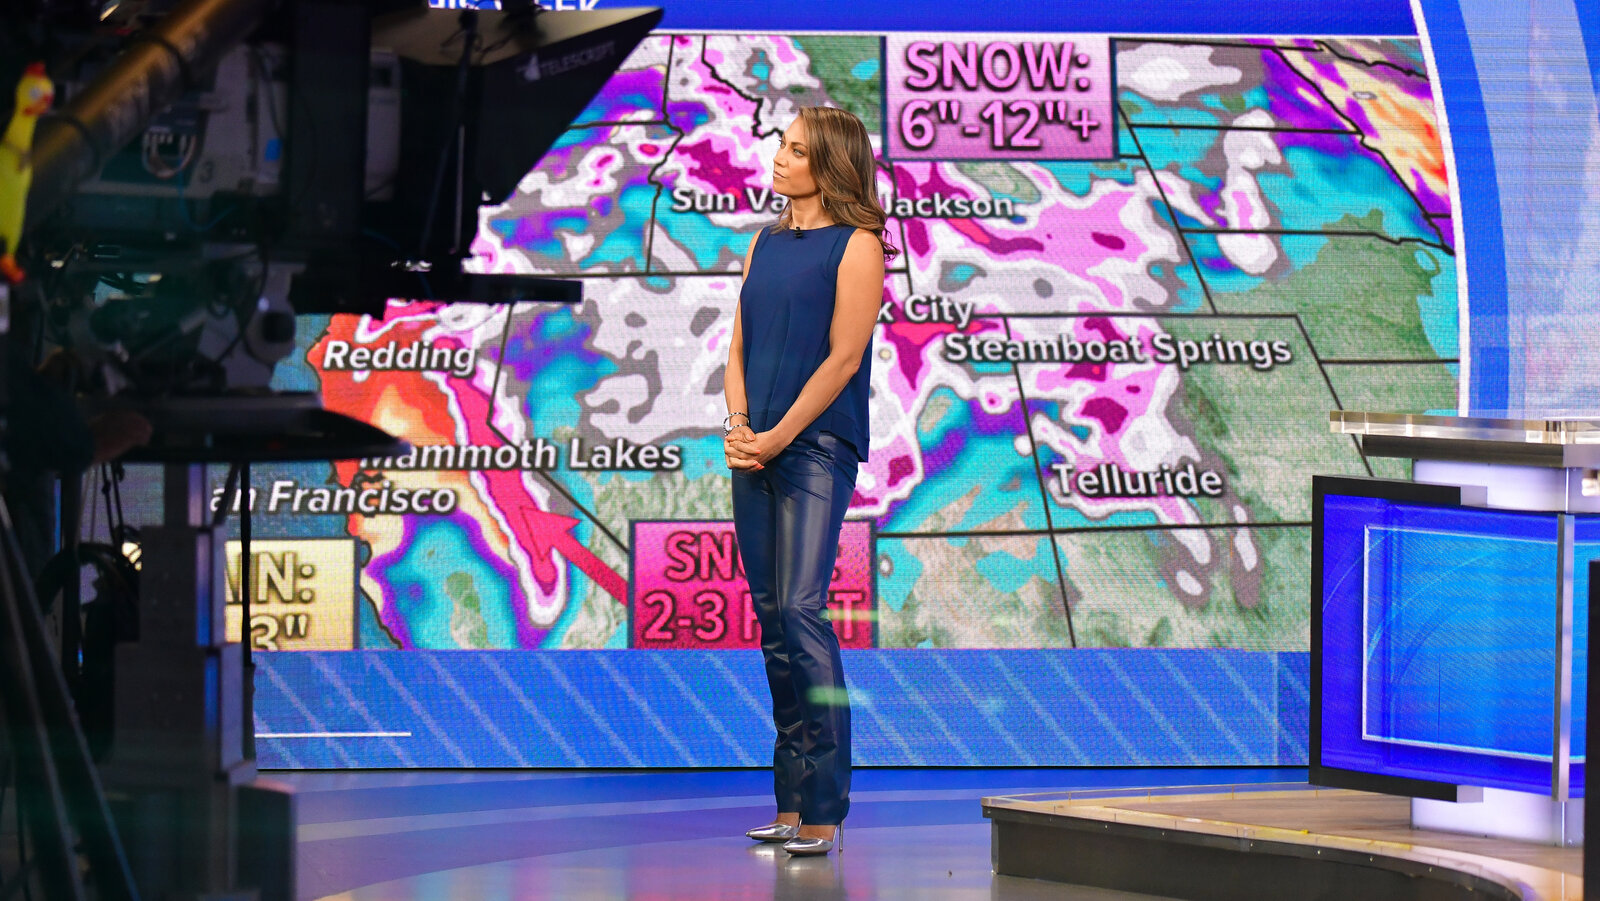
“As Storms Intensify, the Job of TV …” from www.nytimes.com and used with no modifications.
Most people treat allergy medication like a reactive tool — they take it after symptoms start. State-specific pollen forecasts flip that approach entirely. When you know a high tree pollen day is coming tomorrow, you can take a non-drowsy antihistamine like cetirizine or fexofenadine the night before, giving it time to build in your system before exposure hits.
Beyond medication timing, a localized forecast helps you make smarter daily decisions without having to guess.
- Schedule outdoor exercise on low or moderate pollen days instead of peak ones.
- Close windows in the early morning hours when pollen counts are typically highest.
- Plan yard work, gardening, or outdoor events around forecast dips after rain or on cooler days.
- Use the forecast to decide when to shower after being outside to remove pollen from hair and skin.
- Identify which allergen type is peaking so you can target the right medication or nasal spray.
The more specific the forecast, the more actionable your response can be. A state or city-level forecast gives you that specificity in a way a national pollen map simply cannot.
How to Read a Pollen Forecast Without Getting Confused
Pollen forecasts are more useful than most people realize — but only if you know what the numbers and categories actually mean. Once you understand the scale, these forecasts become a genuine daily tool rather than background noise.
What Pollen Count Numbers Actually Mean
- 0–2.4 (Low): Minimal pollen in the air. Most allergy sufferers experience little to no symptoms.
- 2.5–4.8 (Moderate): Sensitive individuals may start to notice symptoms, especially during outdoor activity.
- 4.9–7.2 (High): Most people with pollen allergies will experience noticeable symptoms. Medication is strongly recommended before going outside.
- 7.3–9.6 (Very High): Significant exposure. Even people without diagnosed allergies may feel eye irritation or mild respiratory discomfort.
- 9.7–12.0 (Extremely High): Peak season levels. Limit outdoor exposure, keep windows closed, and use air purifiers indoors.
These numbers represent pollen grains per cubic meter of air, measured at monitoring stations throughout the country. Not every city has a monitoring station, which is why many forecasts use predictive models based on weather data, historical bloom timing, and nearby station readings to estimate local counts. For more detailed information, you can visit the Allergy Ava Pollen Resource.
It’s worth noting that individual sensitivity varies considerably. Someone highly allergic to birch pollen may have severe symptoms at a count of 3.0, while another person might not react until counts exceed 7.0. Tracking your own symptoms alongside the forecast for a few weeks builds a personal baseline that makes the numbers more meaningful for your specific case.
One key detail most people miss: pollen forecasts are often predictive, not real-time. The count shown today typically reflects conditions expected based on temperature, wind, and humidity forecasts — not necessarily what’s in the air at that exact moment. Treat them as planning tools, not live readings.
How Weather Affects Daily Pollen Levels
Wind is the single biggest driver of high pollen days. Warm, dry, and windy conditions pull pollen from trees and grasses and launch it into the air in massive quantities. A single oak tree can release millions of pollen grains in a matter of hours under the right wind conditions. On still, humid days, pollen tends to stay close to its source, which is why coastal or rainy regions often see lower airborne counts despite having plenty of allergenic plants nearby.
Temperature swings also play a direct role in bloom timing. A warm spell in February can trigger early tree pollen release in southern states weeks ahead of the typical forecast window. Conversely, a late cold snap in April can delay grass pollen season in northern states. If you track weather patterns alongside your state pollen forecast, you’ll often be able to predict a high pollen spike before the forecast even updates — warm and dry after a rain almost always means elevated counts within 24 to 48 hours.
How to Use This State-by-State Pollen Directory
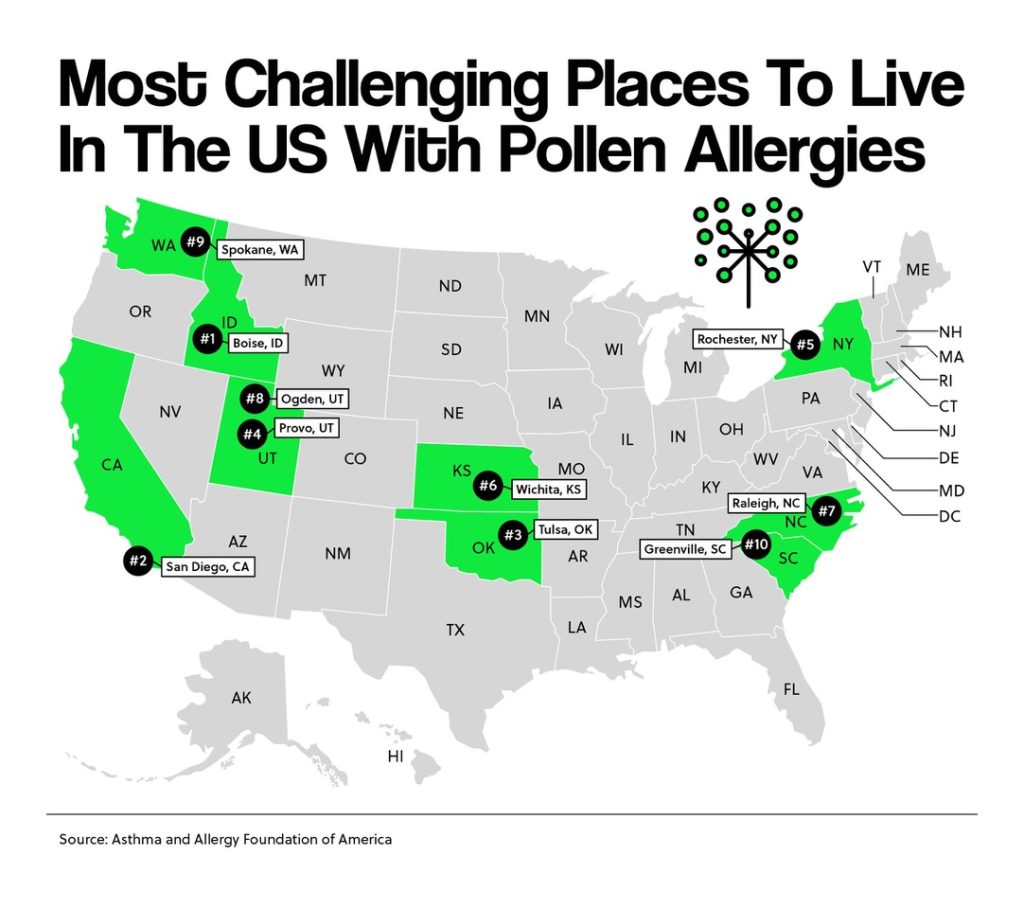
“Worst Cities for Allergies in 2026” from subjecttoclimate.org and used with no modifications.
Navigating pollen data across all 50 states doesn’t need to be complicated. The directory is built to give you a fast, direct path to the allergy information that’s actually relevant to your location — whether you’re at home, planning a trip, or researching a potential move. Start with your state, then drill down to your city for the most localized data available.
Finding Your State and City Forecast
Select your state from the directory to access a statewide pollen overview, including which allergen types are currently active and how conditions compare to seasonal averages. From there, city-level pages are available for major metropolitan areas and many mid-sized cities, providing more granular forecast data, including short-term outlooks and dominant allergen breakdowns. If your specific city isn’t listed, the nearest available city in your climate zone will give you a reliable approximation of local conditions. For additional insights, explore the impact of rain on pollen allergy symptoms.
What Each State Page Shows You
Each state page covers the three primary pollen categories — tree, grass, and weed — with current activity levels and seasonal context. You’ll also find information about the most common allergenic plant species in that state, typical season start and end dates, and how weather patterns in that region tend to influence pollen behavior. For states with significant geographic variation, like California or Colorado, regional differences within the state are addressed so mountain, coastal, and inland residents can get relevant information rather than a one-size-fits-all summary.
Use Pollen Forecasts to Time Medication and Reduce Exposure
The single most effective shift most allergy sufferers can make is moving from reactive to proactive. Antihistamines work best when they’re already in your system before pollen exposure begins — not after your eyes are already itching and your nose is running. State pollen forecasts give you the 24 to 48-hour advance notice you need to make that shift consistently.
Nasal corticosteroid sprays like fluticasone (Flonase) and budesonide (Rhinocort) require even more lead time than antihistamines — some allergists recommend starting them one to two weeks before your regional pollen season peaks for maximum effectiveness. Your state forecast’s seasonal trend data is exactly the tool you need to identify that window without guessing.
When to Take Allergy Medication Based on Forecast Data
Check your state or city forecast the evening before any planned outdoor activity. If tree, grass, or weed pollen is forecast at high or very high levels, take your antihistamine that night rather than waiting until morning. For days forecast at extremely high levels, consider combining a non-sedating antihistamine with a saline nasal rinse in the morning to physically clear pollen from nasal passages before it triggers a full inflammatory response. This two-step approach is significantly more effective than medication alone on peak pollen days.
Outdoor Planning Around High Pollen Days
Pollen counts follow a daily rhythm that most people don’t know about. Levels typically peak between 5 AM and 10 AM, then drop off through the afternoon before rising slightly again in the early evening. If you’re a runner, cyclist, dog walker, or spend any meaningful time outside, shifting your outdoor window to midday or early afternoon on high pollen days can reduce your exposure significantly without cutting outdoor activity out of your routine entirely.
- Before heading outside: Check the forecast for dominant allergen type and count level.
- During outdoor activity: Wear wraparound sunglasses to reduce eye exposure on high tree or grass pollen days.
- After coming inside: Change clothes and shower promptly — pollen clings to hair, skin, and fabric and continues to expose you indoors long after you’ve come back inside.
- At home: Keep windows closed during high pollen periods and run an air purifier with a HEPA filter in your bedroom, particularly during peak season.
Using State Forecasts When Traveling or Relocating
Traveling during allergy season without checking your destination’s pollen forecast is one of the most common mistakes allergy sufferers make. You may have your home region’s pollen calendar figured out, but flying from a low-pollen city in late April to a destination where oak or grass pollen is at peak season can blindside you completely — especially if you haven’t pre-medicated.
Before any trip, pull up the destination state’s pollen forecast for the dates you’ll be there. Look specifically at which allergen type is active, since your personal sensitivity may vary. If you’re highly reactive to grass pollen but not tree pollen, a trip to the Pacific Northwest in June requires a very different preparation than the same trip in February. Bringing a travel pack of your preferred antihistamine and a small saline nasal spray adds almost no luggage weight but makes a significant difference in how you feel during the trip. For those sensitive to grass pollen, consider learning about drought-resistant grasses to better understand what might trigger allergies.
For those considering relocation, state pollen data is a genuinely useful tool for comparing long-term allergy burden between regions. Moving from the Southeast — where pollen seasons are long, intense, and start early — to the Pacific Northwest or a higher-elevation mountain state can meaningfully reduce total annual pollen exposure for people sensitive to oak, cedar, and grass allergens. Conversely, moving to the desert Southwest may reduce tree pollen exposure but significantly increase weed and desert shrub allergen burden in late summer and fall. Use state-level seasonal trend data to make that comparison with real information rather than assumptions. For those interested in effective allergy management, consider exploring eco-friendly air filtration solutions to further alleviate symptoms.
The Right Pollen Forecast Tool Makes a Real Difference
Generic weather apps give you a single pollen number for your city. That’s not enough information to actually manage your allergies. A tool built specifically for pollen tracking — one that separates tree, grass, and weed pollen counts, shows city-level data, and reflects regional plant species rather than a national average — gives you something you can act on every single day of allergy season.
Allergy Ava is built specifically for this purpose, offering state-by-state and city-level pollen forecasts that break down active allergen types and provide seasonal context for every region of the country. Whether you’re managing a known tree pollen allergy or trying to figure out why your symptoms spike every August, having a dedicated pollen resource tied to your specific state and city changes the quality of information you’re working with — and by extension, how well you can actually control your symptoms.
Frequently Asked Questions About State-Specific Pollen Forecasts
Pollen forecasts raise a lot of practical questions, especially for people who are newer to tracking allergen data or who have recently moved to a different region. The questions below cover the most common points of confusion, from finding city-level data to understanding what a high count actually means for your daily decisions.
One thing worth emphasizing before diving into the specifics: pollen forecasting is part science and part estimation. Monitoring stations exist in most major metropolitan areas, but rural regions often rely on predictive models based on temperature, humidity, wind, and historical plant behavior. The forecasts are highly useful, but they’re best treated as directional guides rather than exact measurements — especially for cities without a dedicated monitoring station. For more on how weather impacts pollen, you can read about rain’s impact on pollen allergy symptoms.
With that context in place, here are answers to the questions that come up most often about state-specific pollen forecasts.
Quick Reference: Most Common Pollen FAQs
Question Short Answer How do I find city-level data? Use a state directory with city-level pages, like Allergy Ava Why do bordering states differ so much? Different plant species, elevation, and climate zones Can forecasts help with travel planning? Yes — check destination state before departure How often are forecasts updated? Typically daily, sometimes twice daily during peak season What count means stay indoors? Very High (7.3+) or Extremely High (9.7+) for sensitive individuals
Use the table above as a quick reference, and read the detailed answers below for more actionable context on each point. For those interested in gardening, check out our indoor flowering plants guide for sustainable urban gardening tips.
How Do I Find a Pollen Forecast for My Specific City?
To find a city-level pollen forecast, start with a state-specific pollen directory that supports city-level navigation. On Allergy Ava, you can select your state from the directory, then choose your city from the available list. Major cities like Denver, Atlanta, Portland, and Houston have dedicated pages with current counts, dominant allergen breakdowns, and short-term outlooks. If your specific city isn’t listed, select the nearest city within the same climate zone — regional vegetation and weather patterns are similar enough that a nearby city’s forecast will closely reflect your local conditions. Additionally, understanding rain’s impact on pollen can help you better interpret these forecasts.
Why Are Pollen Levels Different in States Right Next to Each Other?
| Factor | How It Affects Pollen Levels | Example |
|---|---|---|
| Dominant Plant Species | Different trees and grasses produce different allergens at different times | Live oak in Texas vs. birch in Minnesota |
| Elevation | Higher elevations delay bloom timing by weeks | Denver vs. Kansas City in spring |
| Humidity & Rainfall | Wet climates suppress airborne pollen; dry climates amplify it | Seattle vs. Portland, Oregon |
| Average Temperature | Warmer states trigger earlier and longer seasons | Florida vs. Georgia in January |
| Wind Patterns | Prevailing winds carry pollen across state lines | Plains states in grass season |
Pollen levels between neighboring states differ primarily because of plant geography, not state borders. The vegetation that grows in North Carolina’s piedmont region is simply different from what dominates southern Virginia’s landscape, even though those areas are geographically close. Add elevation changes, different rainfall averages, and varying temperature curves, and two adjacent states can be in entirely different stages of their allergy season simultaneously. For more information on how rainfall impacts pollen levels, check out this resource.
Climate zones are the most reliable way to think about this. Rather than looking at state lines, consider whether your region is classified as humid subtropical, semi-arid, Mediterranean, or continental — these classifications tell you far more about what pollen to expect and when than state boundaries alone. The Southeast’s humid subtropical climate drives an almost year-round allergy season for tree and grass pollen, while the continental climate of the upper Midwest compresses pollen season into a shorter but intense window.
Wind is another major variable that creates cross-state pollen movement. During peak grass pollen season in the Great Plains, prevailing southerly winds regularly carry pollen from Texas and Oklahoma northward into Kansas and Missouri, elevating counts in those states even before local grass species have fully peaked. Checking the wind forecast alongside your state pollen forecast gives you a more complete picture of what’s actually in the air on any given day.
Can I Use These Forecasts to Plan Travel Around Allergy Season?
Absolutely — and this is one of the most underused applications of state pollen data. Before booking a trip or finalizing travel dates, pull up the destination state’s pollen forecast and cross-reference it with the seasonal trend data for that region. If you’re traveling to Savannah, Georgia in March, you’re walking into one of the most intense oak pollen seasons in the country. Knowing that in advance means packing your antihistamines, not discovering you need them after your first day outdoors.
For longer trips or extended stays, look at the seasonal calendar for the destination state, not just the current count. A trip planned for mid-May in the Pacific Northwest may look fine on a week-out forecast but land right in the middle of peak grass pollen season for the Willamette Valley — one of the highest grass pollen regions in North America. State-level seasonal context gives you a planning window that a seven-day forecast simply can’t provide.
How Often Are State Pollen Forecasts Updated?
Most reputable pollen forecast platforms update their data daily, with some providing twice-daily updates during peak allergy season when conditions are changing rapidly. Updates typically incorporate the latest weather model data — temperature, wind, humidity, and precipitation forecasts — along with readings from nearby pollen monitoring stations where available. The evening update is particularly useful for planning the following day, since it reflects the overnight temperature forecast that often determines how much pollen will be released at dawn.
It’s worth checking the “last updated” timestamp on any forecast you’re reading, especially during transitional weather periods when conditions shift quickly. A forecast updated 18 hours ago during a dry stretch may not reflect a rain event that happened overnight, which would actually lower your expected count for the morning significantly. Daily check-ins during high-sensitivity periods will always give you better information than checking once at the start of the week.
What Is Considered a High Pollen Count, and Should I Stay Indoors?
A pollen count above 7.3 is classified as Very High, and counts above 9.7 are considered Extremely High. For most people with diagnosed seasonal allergies, Very High days warrant proactive medication and reduced outdoor exposure — particularly during the peak morning hours. At Extremely High levels, staying indoors during the 5 AM to 10 AM window is a practical recommendation for anyone with moderate to severe pollen sensitivity.
That said, “staying indoors” doesn’t mean you’re fully protected unless your indoor air quality is also managed. Pollen enters homes through open windows, on clothing, in pet fur, and through HVAC systems without proper filtration. On Extremely High pollen days, running a HEPA air purifier in your bedroom, keeping windows closed, and removing shoes at the door reduces your total allergen load even when you’re inside all day.
The most important takeaway is that the threshold for action is personal. If you know from experience that you react at counts of 4.0 for a specific allergen — say, mountain cedar or Timothy grass — then Moderate days are your personal High days, and your planning should reflect that. Use your state forecast as a foundation, then layer your own symptom history on top of it to build a pollen response plan that actually matches your biology. That combination of localized data and personal tracking is the most effective allergy management strategy available without a prescription.
For ongoing allergy support, state-level forecasts, and city-specific pollen data across all 50 states, Allergy Ava provides the localized, allergen-specific information you need to stay ahead of pollen season — not just react to it.